Interactive Timeline
Posted: 25 Jun 2025. Last modified on 10-Jul-25.
This article will take about 4 minutes to read.
Interactive Historical Timeline
This project provides a dynamic and interactive visualization of historical events using web technologies. It is designed to present chronological data in an organized and visually distinct manner.
Core Functionality
The timeline operates by processing structured historical data and rendering it into an interactive display. Key aspects include:
- Dynamic Rendering: The timeline’s visual components are generated programmatically from a defined JavaScript data structure, eliminating the need for static, pre-drawn elements.
- Categorization: Events are logically grouped into high-level
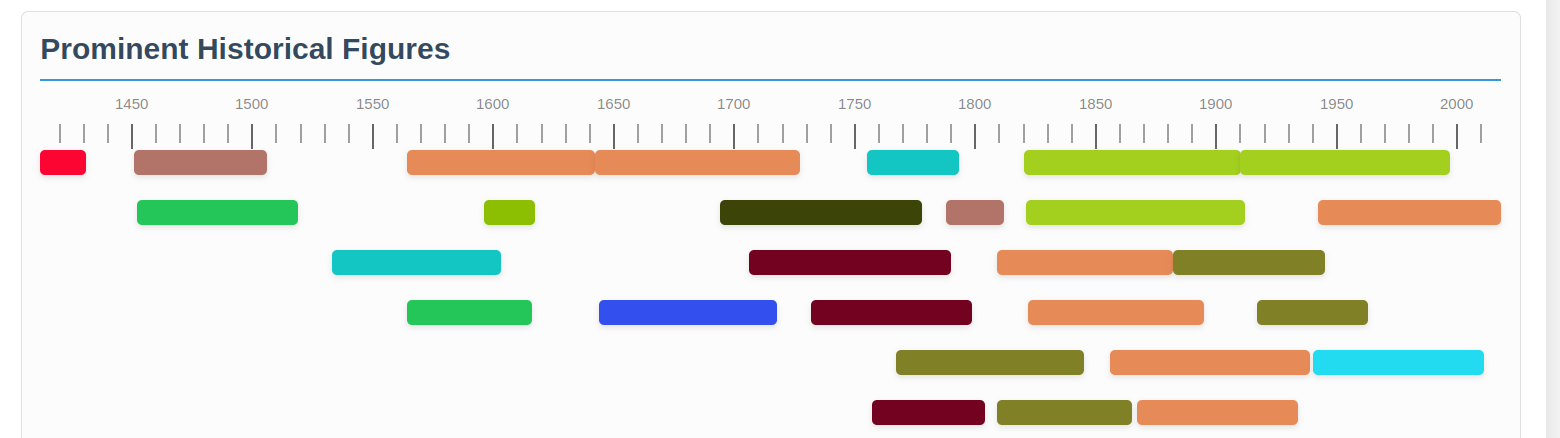
categories(e.g., “Prominent Historical Figures”) to facilitate structured navigation and comprehension. - Collision Avoidance (Laning): An algorithm assigns events to distinct horizontal “lanes” to prevent visual overlap, ensuring readability, particularly during periods of high event density.
- Temporal Representation: Events are visually scaled to represent their duration. Discrete, single-year events are rendered as points, while multi-year events are displayed as spans.
- Event Details on Interaction: Hovering over an event triggers the display of a popup containing detailed information, including the event’s name, sub-category, time period, and description.
- Semantic Coloring: Each unique event
category(a more granular sub-grouping of events) is programmatically assigned a distinct, random color. This provides immediate visual cues for thematic identification. - Chronological Markers: Integrated year ticks serve as a clear, consistent temporal reference system across the timeline.
Setup and Execution
To deploy and execute this project, a standard web browser is the sole prerequisite.
- File Placement:
- Save the primary HTML content, including embedded CSS (
<style>) and JavaScript (<script>) tags, asindex.html. - The
timelineDataJavaScript array, which contains all historical event information, must be saved astimelineData.jswithin the same directory asindex.html. - The
generateRandomCategoryColorsJavaScript function should be saved asutils.jsin the same directory. - Ensure
index.htmlcorrectly references these external JavaScript files via<script src="timelineData.js"></script>followed by<script src="utils.js"></script>.
- Save the primary HTML content, including embedded CSS (
- Browser Launch: Open the
index.htmlfile using any compatible web browser. The timeline will render automatically upon loading.
Data Schema: timelineData
The timeline’s content is driven by the timelineData JavaScript array, structured as follows:
const timelineData = [
  {
    "category": "Main Event Grouping", // e.g., "Prominent Historical Figures"
    "events": [
      {
        "name": "Event Title",
        "start_year": 1776, // Integer year; negative values for BCE.
        "end_year": 1783,   // Integer year; identical to start_year for point events.
        "description": "Concise summary of the event.",
        "category": "Event Sub-Category" // Crucial for visual distinction via coloring.
      },
      // ... additional event objects
    ]
  },
  // ... additional main event groupings
];
category: Represents the primary grouping title for a collection of events.events: An array comprising individual event objects.name: The designated title for the event.start_year/end_year: Define the temporal boundaries of the event.description: Provides supplementary contextual information.category: Mandatory for coloring. This sub-category string is used to apply a unique color to the event’s visual representation.
Customization Guide
The project architecture supports straightforward modification and extension.
- Data Manipulation: Events can be added, modified, or removed by directly editing the
timelineData.jsfile. All required properties (name,start_year,end_year,description,category) must be present for each event. - Category Expansion: The introduction of new
event.categoryvalues will be automatically detected by thegenerateRandomCategoryColorsfunction, which will assign a new random color. - Visual Styling: All aesthetic properties are controlled via the CSS rules embedded within the
<style>tags ofindex.html. This includes color schemes, typography, and element dimensions. - Temporal Scaling: The timeline’s scale automatically adjusts to encompass the entire temporal range of the provided data. Granularity of year markers and vertical spacing of event lanes can be fine-tuned by adjusting variables such as
tickIntervalMajor,tickIntervalMinorin the JavaScript andtopproperty for.event-lanein the CSS.